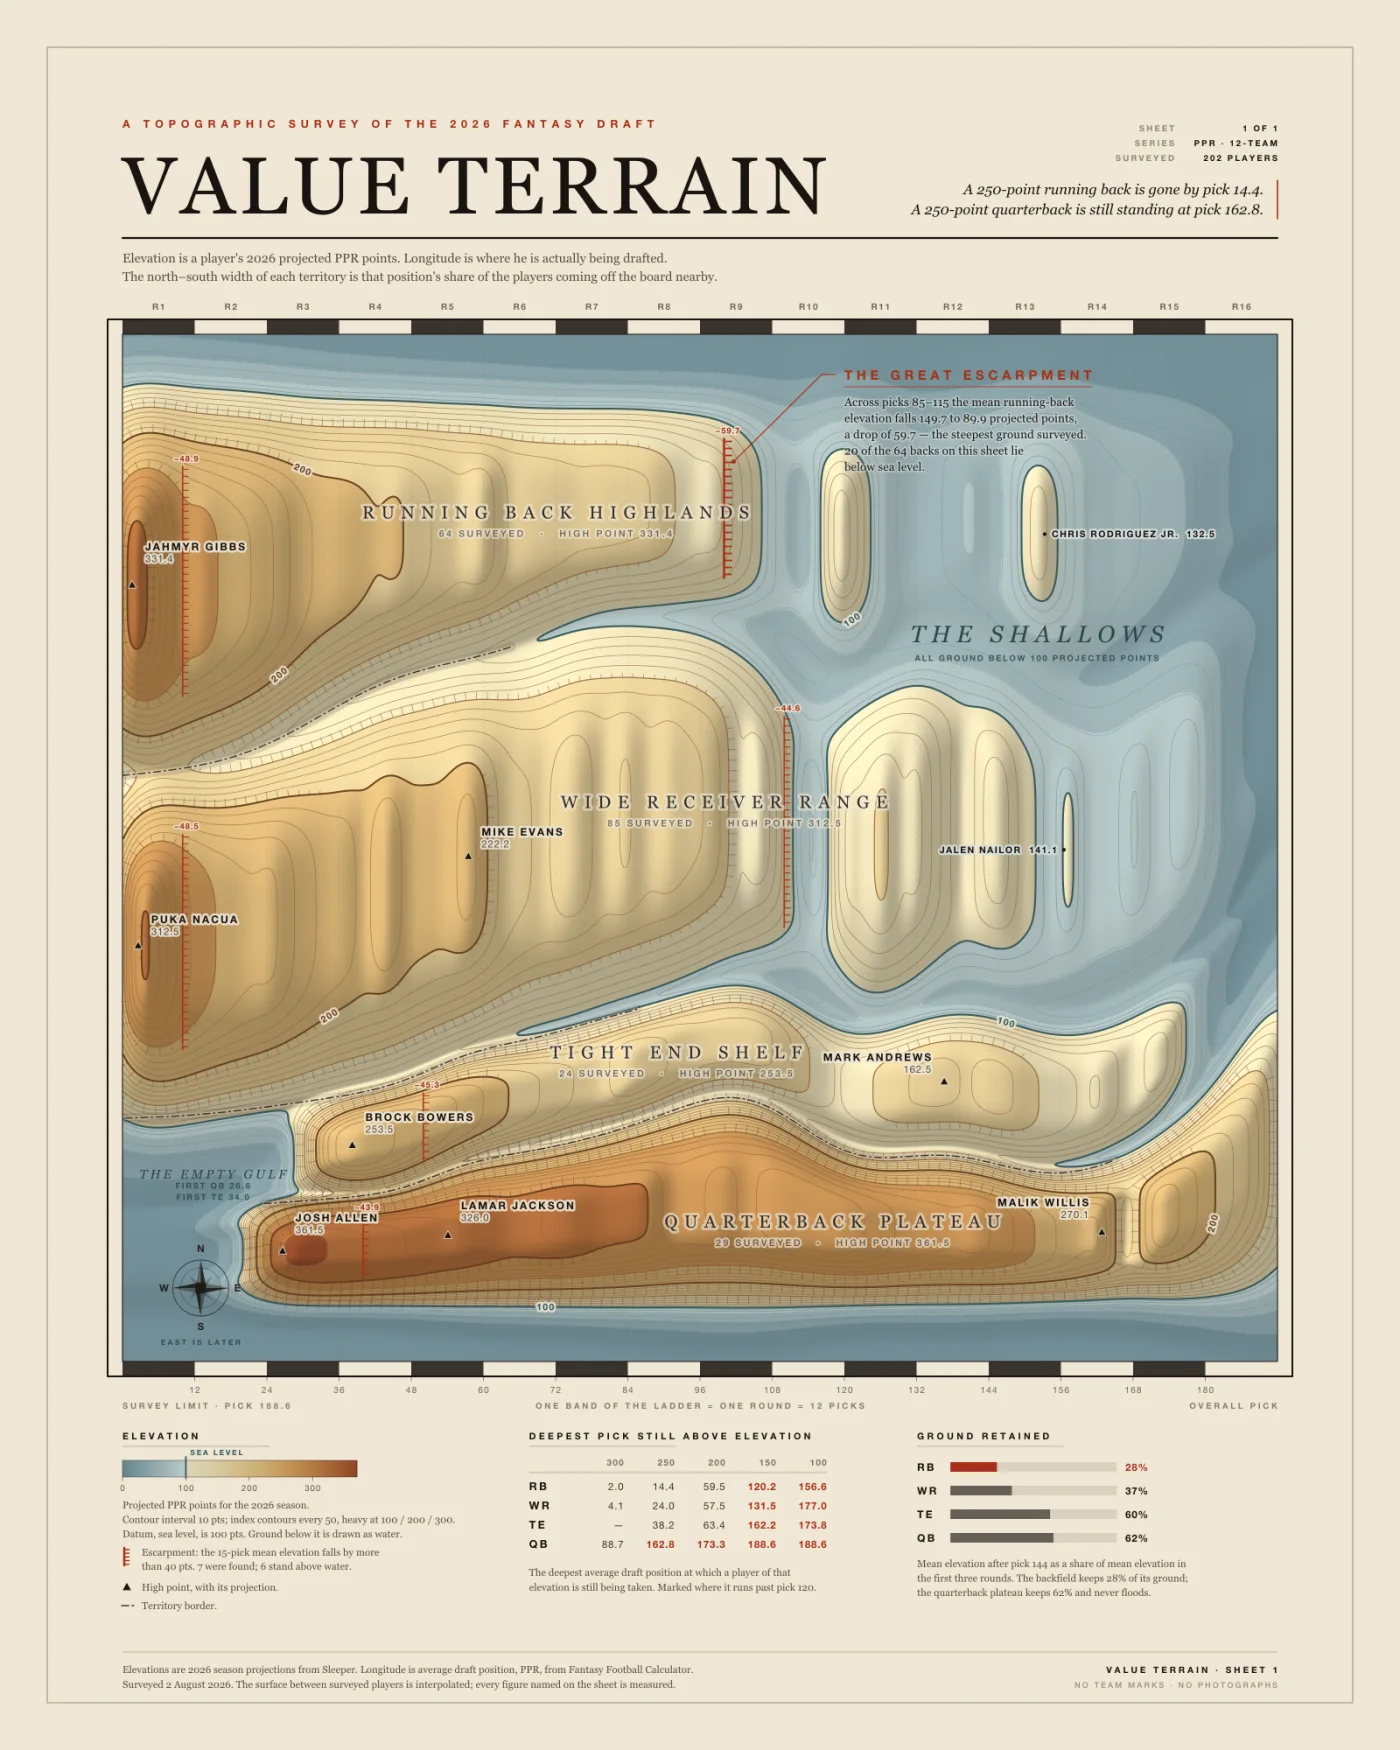
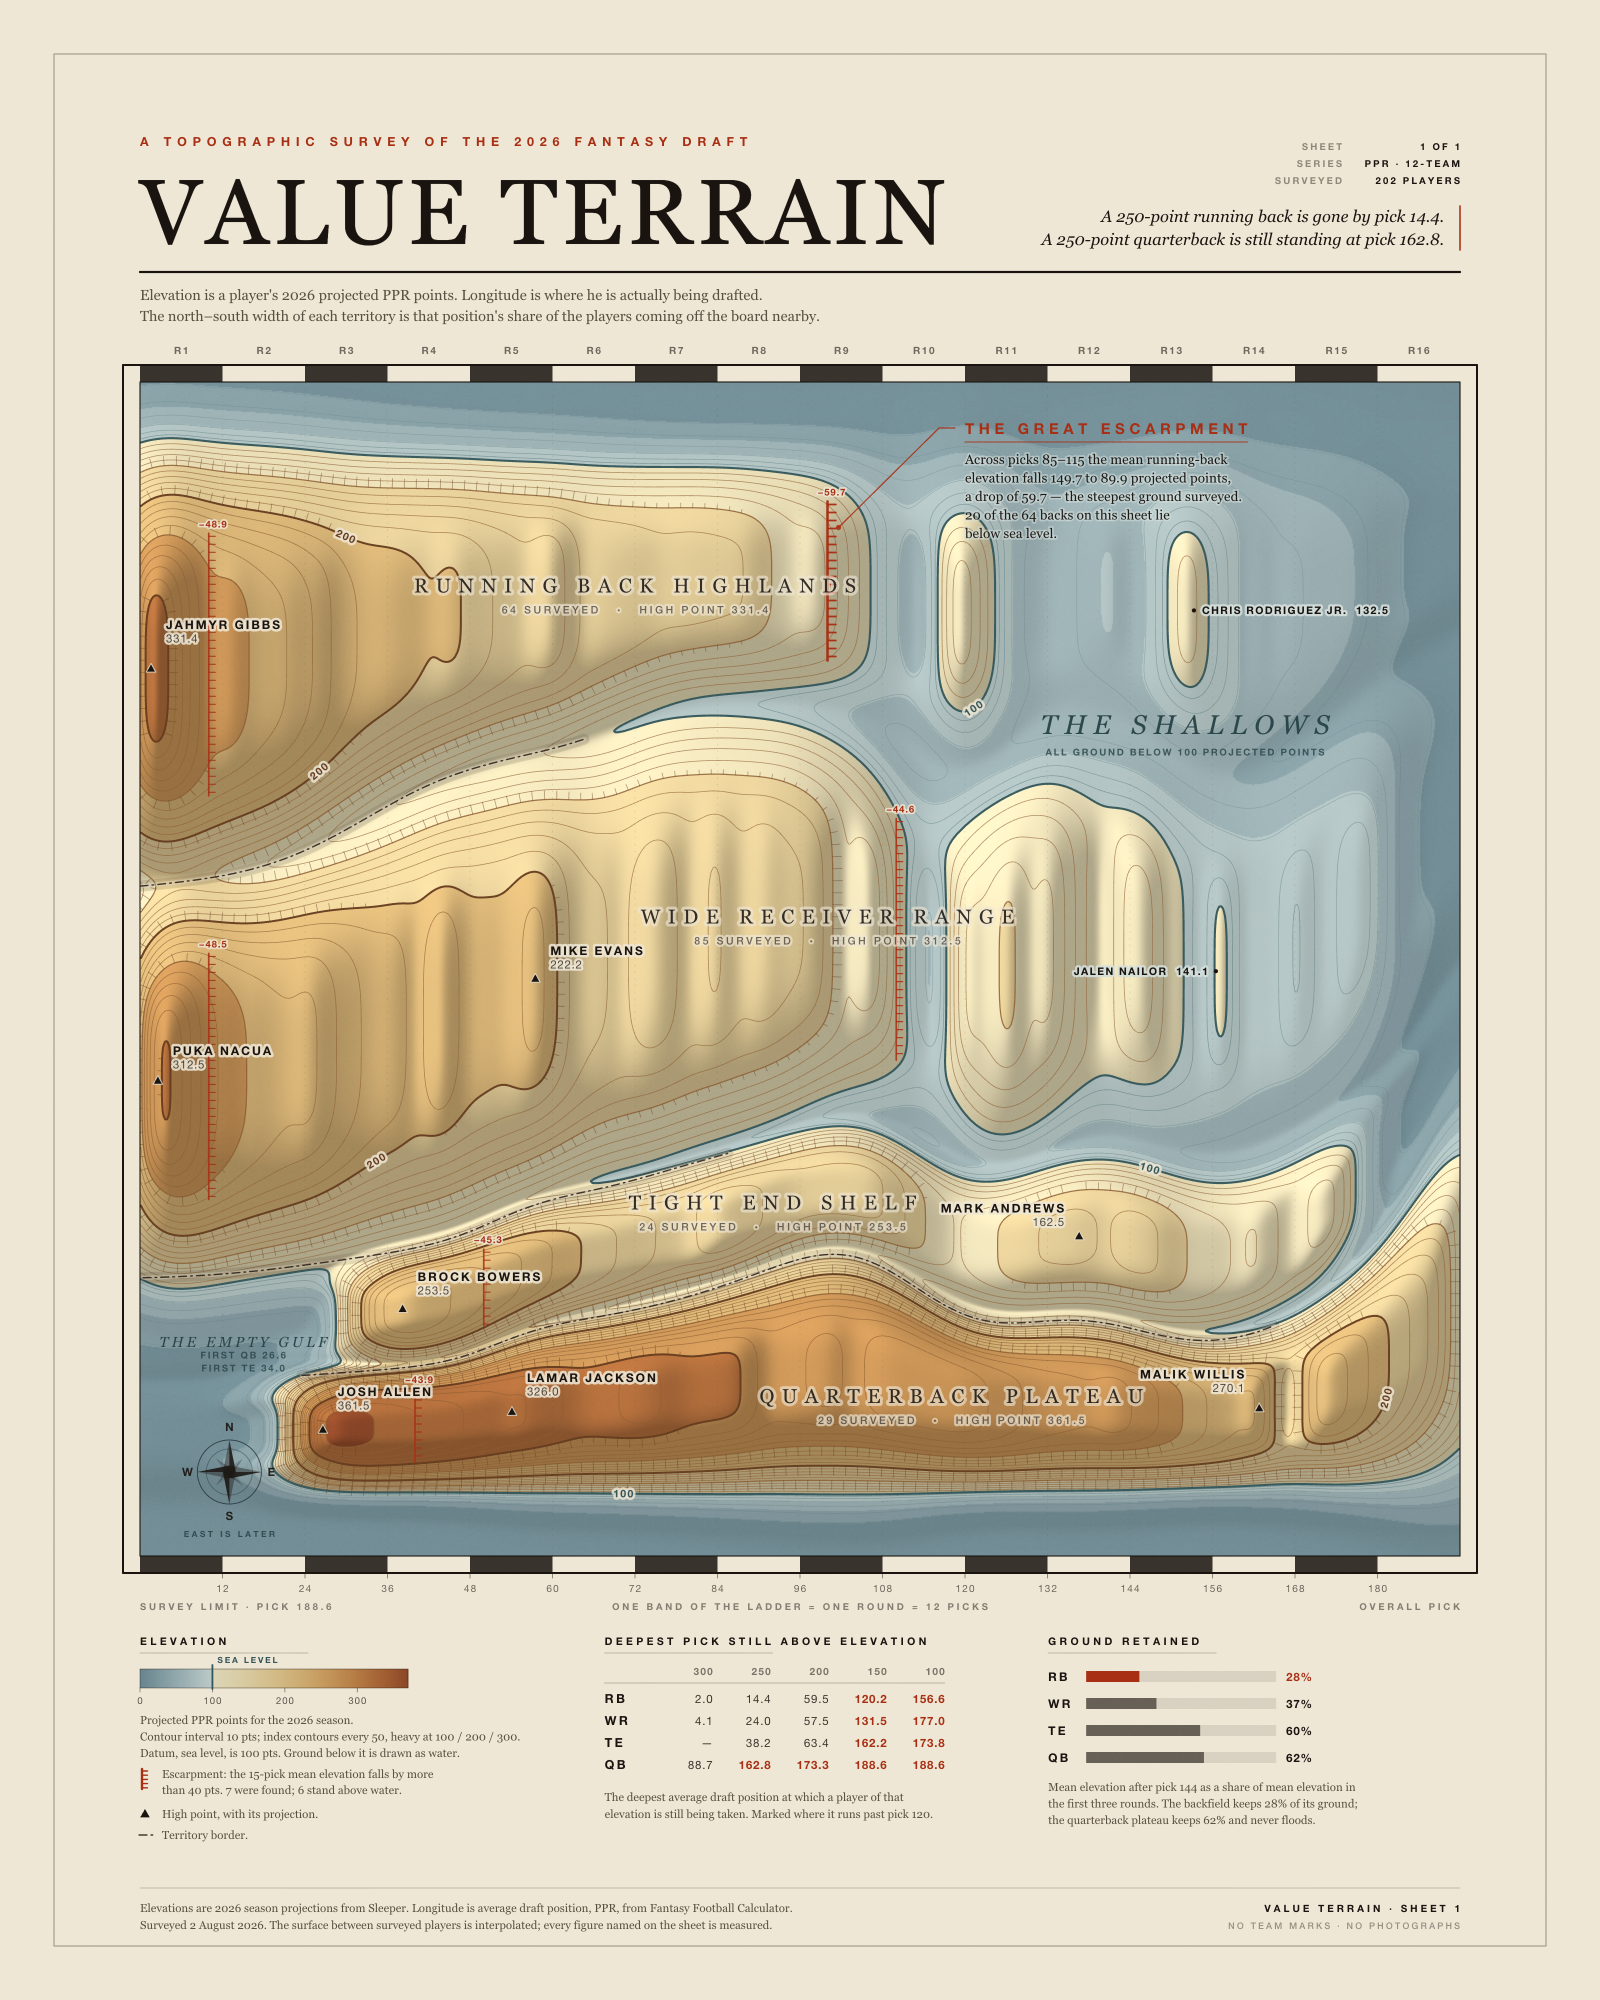
Running Back Highlands
64 surveyed · high point 331.4The steepest ground on the sheet, and the only range that drowns. 20 of the 64 backs surveyed sit below the hundred-point datum, so the north-east of the map dissolves into shoals and a handful of stranded islands.
The Great Escarpment
−59.7 pointsAcross picks 85–115 the mean running-back elevation falls from 149.7 to 89.9 projected points. Seven falls steeper than forty points were found across the four territories; six of them stand above water, and this is the steepest of all.
The Shallows
All ground below 100 pointsEverything drawn as water is a player projected under the hundred-point datum. Thirty-five of the 202 surveyed lie there — 20 backs and 15 receivers. No quarterback and no tight end floods.
The Empty Gulf
First QB 26.6 · first TE 34.0The south-west corner of the sheet is water because nothing is drafted there. No quarterback goes before pick 26.6 and no tight end before 34.0, so the two southern ranges simply begin two rounds late.
Quarterback Plateau
62% of its ground retainedThe southern range barely tilts. Mean elevation after pick 144 is 62% of mean elevation in the first three rounds — against 28% for the backfield, which keeps barely a quarter of its height and then floods.
The 250-point contour
14.4 → 162.8Trace one contour east and the whole thesis arrives. A 250-point running back is gone by pick 14.4. A 250-point quarterback is still standing at pick 162.8 — one hundred and forty-eight picks later, for the same elevation.
One contour, traced east
Every draft board is an argument about when. Trace the 250-point contour from the western edge of the sheet and the argument resolves into four numbers: the deepest average draft position at which a player of that height is still being taken.
Running back
14.4
Wide receiver
24.0
Tight end
38.2
Quarterback
162.8
A 250-point back is gone by pick 14.4. A 250-point quarterback is still there at 162.8 — one hundred and forty-eight picks later, for the same elevation.
| Elevation | 300 | 250 | 200 | 150 | 100 |
|---|---|---|---|---|---|
| Running back | 2.0 | 14.4 | 59.5 | 120.2 | 156.6 |
| Wide receiver | 4.1 | 24.0 | 57.5 | 131.5 | 177.0 |
| Tight end | — | 38.2 | 63.4 | 162.2 | 173.8 |
| Quarterback | 88.7 | 162.8 | 173.3 | 188.6 | 188.6 |
What the north–south axis is carrying
A map has a dimension a graph does not, and Sheet 1 spends it carefully. Its east–west axis is measured: longitude is average draft position. Its elevation is measured: height is projected points. Even its territory widths are measured — the north–south thickness of each range is that position's share of the players coming off the board nearby, so the borders swell and pinch as the draft moves east.
The shape of the ground between those borders is not. Each range is a single east–west profile given a smooth, invented cross-section — a flat-topped bell the renderer draws to turn a line into a landmass. Four one-dimensional profiles, inflated. Nothing north or south of a range's spine was ever surveyed, because there is nothing there to survey.
Sheet 2 removes the dimension rather than filling it with fiction. A section has no north–south axis, so it has no room to lie. And it spends the space it does have on a second measurement the map never showed: σ, the standard deviation of the pick at which the market actually takes each player. The crest is displaced by ±σ on the elevation scale, so ground the market agrees about is drawn smooth, and ground it argues over is drawn broken.
The smooth west
σ 1.33 picksAcross the eleven players taken in round one the mean σ is 1.33 picks. Jahmyr Gibbs goes at 1.6 with a σ of 0.7 — the market does not argue about him at all — and the western crest is very nearly a drawn line.
The broken east
σ 18.56 picksMean σ rises in every one of the first thirteen rounds — 1.33, 3.30, 4.14, and on up to 18.56 by round thirteen. The ridge shatters with it. Across all 202 surveyed the mean is 11.61 picks: 39 players sit under five, 23 at twenty or above.
Running Back Highlands
2.92 → 20.59 picksThe backfield both drowns and shatters. Mean σ among backs taken in the first three rounds is 2.92 picks; after pick 144 it is 20.59 — seven times rougher. Receivers multiply by 5.3, tight ends 3.2, quarterbacks 2.3. Nothing breaks up as fast as running back.
Tight End Shelf
mean σ 17.07 picksThe smallest territory is the most argued over. Twenty-four tight ends carry a mean σ of 17.07 picks, against 9.26 for the eighty-five receivers. The shelf is low, and nobody agrees where on it to stand.
Tucker Kraft
σ 26.9 · picks 44 to 168No player drafted more than a hundred times is argued over more. Across 515 recorded drafts Kraft has gone as early as pick 44 and as late as 168 — a 124-pick argument, settling at an average of 107.7. That is 2.1× the mean σ of his own round.
Quarterback Plateau
mean σ 12.43 picksThe southern range keeps its height and never floods — but it is not smooth. Mean σ across the twenty-nine quarterbacks is 12.43 picks, rougher than the eighty-five receivers at 9.26. The market is settled on what a quarterback is worth and unsettled about when to pay for him.
What is measured and what is drawn
Sheet 1. Every elevation, contour crossing and figure named on the map is an output row of one of the five queries carried in the plate's own HTML header. The surface between surveyed points is interpolated, and the north–south width of each territory is that position's share of the players coming off the board nearby. The north–south relief — the cross-section that turns each profile into a landmass — is a drawing device and encodes nothing. It is named here rather than defended.
Sheet 2. Longitude is average draft position and height is 2026 projected PPR points, both measured, both on the same scales as the map. Crest displacement is ±σ from Q6, plotted against the elevation axis — a declared roughness scale, in the manner of a section's vertical exaggeration note. The only invented quantity on the sheet is where inside ±σ the crest wanders: two octaves of seeded value noise, mulberry32, seed 20260802, identical on every load. The dashed line under each crest is the measured profile itself.
Roughness is partly mechanical. A pick late in the draft has more room to vary than a pick early in it, so σ widens eastward everywhere regardless of genuine disagreement. Named arguments are therefore quoted against their own round's mean rather than against the survey's: Tucker Kraft's σ of 26.9 is 2.14× the 12.6 mean of round nine.
Thin samples are drawn, not corrected. σ is only as good as the number of drafts behind it. 30 of the 202 surveyed have fewer than twenty-five recorded drafts. The extreme case is Jaydon Blue: σ 60.5 from 7 drafts, taken as early as pick 1 and as late as 195. The crevasse he opens in the eastern backfield is real in the data and close to meaningless as a reading.
Scope. PPR average draft position from Fantasy Football Calculator, 2026 season projections from Sleeper, joined on Sleeper id. Players carrying an ADP but no projection, or a projection but no ADP, are on neither sheet.
Where these numbers come from
Sources & freshness
- Sleeper — 2026 projections02 Aug 05:51
- FantasyFootballCalculator — ADP02 Aug 05:31
- Sleeper — player universe02 Aug 05:31
The queries
Five statements are printed in full in the plate's own HTML header and carry
Sheet 1: Q1 the 202 survey points, Q2 the
contour ladder, Q3 escarpments, Q4 ground
retained, Q5 provenance. Sheet 2 adds two, run against
data/snapshot.sqlite3 opened read-only:
Q6 and Q7, in full
-- Q6  THE ROUGHNESS SURVEY POINTS (202 rows)
--     every crest, every summit dot, every whisker
SELECT a.position pos, a.name, ROUND(a.adp,2) adp,
       ROUND(a.stdev,2) sd, a.high earliest, a.low latest,
       a.times_drafted td, ROUND(pr.pts_ppr,1) pts
FROM adp a
JOIN projections pr
  ON pr.sleeper_id = a.sleeper_id AND pr.season = '2026'
WHERE a.scoring = 'ppr'
  AND a.position IN ('QB','RB','WR','TE')
ORDER BY a.position, a.adp;

-- Q7  DISAGREEMENT BY ROUND  (the smooth west, the broken east)
WITH p AS (
  SELECT a.position pos, a.adp, a.stdev sd, a.times_drafted td,
         CAST((a.adp - 0.0001) / 12 AS INT) + 1 rnd
  FROM adp a
  JOIN projections pr
    ON pr.sleeper_id = a.sleeper_id AND pr.season = '2026'
  WHERE a.scoring = 'ppr'
    AND a.position IN ('QB','RB','WR','TE'))
SELECT rnd, COUNT(*) n, ROUND(AVG(sd),2) mean_sd,
       ROUND(MIN(sd),1) mn, ROUND(MAX(sd),1) mx
FROM p GROUP BY rnd ORDER BY rnd;
The rails
- Every printed figure is query output.
- No league marks, logos, or photographs.
- Nothing is fetched at view time.
- Deterministic: seeded noise only.